In this application note two different segmentation methods – classic thresholding and machine learningbased – are evaluated in the context of quantitative analysis of constituents of state-of-the-art lithium-ion batteries. Both methods are compared against reference measurements using a laboratory balance. A detailed description of the fundamental functionality of the machine learning based approach is given. It has the potential to be more robust against image variations and thus can provide a more accurate segmentation result.
Introduction
As a form of rechargeable energy storage with high energy density, lithium-ion batteries have become indispensable to portable electronic devices such as mobile phones, computers, medical equipment, and construction power tools as well as transportation applications such as electric vehicles, making them crucial for current societal demands.
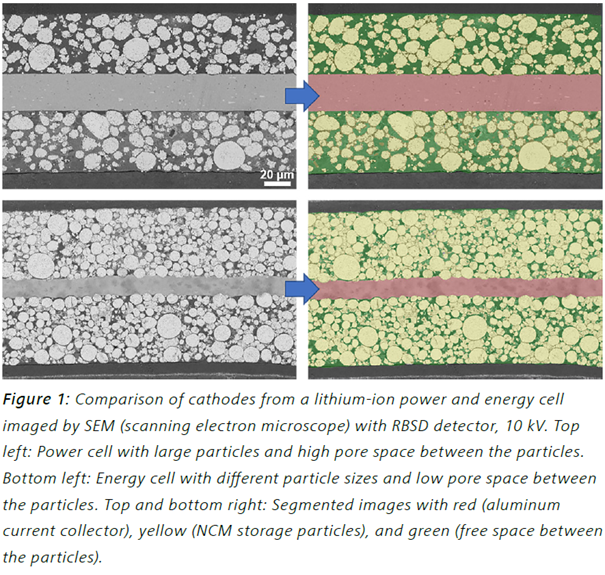
As the demand for such energy storage increases, so too does the demand for improved performance and lifetime, as well as for reducing overall cost. In order to address these challenges and continuously improve battery performance, evaluation of the microstructure of lithium-ion batteries is needed. Additionally, understanding that is achieved through postmortem analysis enables further improvements in research and manufacturing. Here, the module ZEISS ZEN Intellesis for the image analysis software ZEISS ZEN core sets new standards in the field of quantitative microstructure analysis. Through its easy-to-use machine learning-based image segmentation, ZEN Intellesis allows easy phase content determination in a battery to a high degree of accuracy. The phase contents – here considered to be particles, pores, and current collector – determine the performance of a battery on the microstructure level (see Figure 1).
This paper compares three different evaluation methods used to quantitatively assess the particle content of cathodes from current state-of-the-art lithium-ion batteries. 18650 batteries are the most common format on the market and are therefore used as test samples here.
Experimental Methods
As two digital evaluation methods, classical threshold value segmentation is compared to segmentation using ZEN Intellesis. Since no compositional information about the particle content and porosity of the batteries was available from the manufacturer, gravimetric analysis is used as a reference and third evaluation method. In this latter analysis, the batteries are disassembled down to the electrode level and measured using a laboratory balance. The phase contents are then determined with regard to the specific bulk densities of the materials present.
The aim of manufacturing the electrodes of power cells is to deliver high current in a short period of time. This is achieved industrially through a lower compression of the electrode coating. On the microstructure level, this results in more free space between the particles and thus relatively high porosity with lower particle content. The opposite goal is pursued when manufacturing energy cells. In energy cells, high energy should be stored in the smallest possible space. This is achieved through a greater compression of coatings, thus resulting in relatively higher particle content and lower porosity.
Machine Learning-based Phase Analysis Using ZEN Intellesis
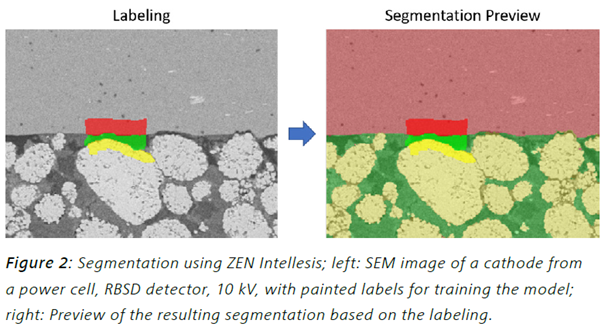
ZEN Intellesis can be used as a simple, fast, and highly reliable means of segmenting images for phase analysis. This is done using pixel classification based on machine-learning algorithms. For this purpose, the user creates a segmentation model using training data in the form of a subset of the images to be evaluated. The user has to provide ZEN Intellesis with the necessary input to train the model. For this purpose, the phases to be segmented are marked by drawing with the mouse on the image in a process called labeling. Precise labeling and covering distinctive regions and especially boundaries for each phase should be prioritized over labeling large parts of the image. Additionally, the amount of labeling should be balanced and roughly the same for all phases. The labeled pixels are then characterized by so-called feature vectors. A feature vector describes a set of specific properties (i.e. features) of a pixel, e.g. its (gray) color value or how it responds to certain image filter operations, which can be e.g. sensitive to edges or neighboring pixels in different ranges. The dimension of a feature vector is given by the number of features it takes into account. The choice of the feature vector determines the resulting segmentation model and its performance. It is basically the only parameter that has to be set when using ZEN Intellesis. The user can choose from a list of feature vectors. ZEN Intellesis offers two basic feature vectors with 25 or 33 predefined hand-picked and engineered features. These basic feature vectors are suited for the majority of microscopy images and applications. To cover special cases, the user can select one of the deep feature vectors. These extract the features from different layers of a pretrained deep neural network that first analyzes the image. With a dimension from 50 to 256, deep feature vectors are more computationally intensive. To finally train the segmentation model, the feature vectors of all labeled pixels are matched against their assigned phase information to form a collection of decision trees. Each of these trees is capable of assigning a phase to a pixel based on the features of that pixel, but was “grown” (i.e. derived) with slight, random variations during training - hence, this type of classifier is called random forest. The randomness helps to increase the prediction quality of the model. The final decision on which phase to assign is simply taken by following the majority vote of all trees.
Training the model is an iterative process. While labeling, the user can get a preview of the segmentation result at any time and adapt the labeling accordingly, e.g. paint over wrongly segmented pixels. Once the segmentation result is considered to be optimal, training is finished, and the model can be used to segment single images or even series or stacks of images. Figure 2 shows an example of labeling in ZEN Intellesis, with the resulting segmentation preview.
Threshold-based Phase Analysis
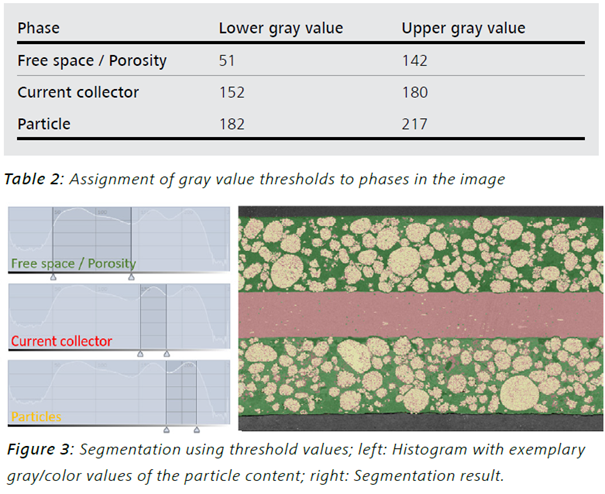
For phase analysis using a global threshold, the image is segmented by its 255 gray or color levels (in RGB mode, 255 levels per red, green, and blue channel). Each phase is assigned to an intensity range. The upper and lower limits of this range are selected manually by the user, so that the corresponding pixels coincide as well as possible with the image areas of the respective phase. Table 2 exemplarily lists the gray values that were assigned to the different phases for a power cell image. Threshold-based segmentation can be nicely visualized using the histogram of the image, which shows the frequency of all gray or color values. The thresholds are displayed as vertical lines at their corresponding position on the x-axis, and the histogram area in-between represents all pixels counted for that phase (see Figure 3).
Results And Discussion
For this study, a series of 15 SEM (scanning electron microscope) images of a cathode from a power cell and an energy cell were evaluated. To segment the phases, a ZEN Intellesis model was compared with a threshold-value-based evaluation. In both cases, one out of the 15 images was used to train the segmentation model and derive the thresholds respectively. The same model and threshold values were then applied to the whole image series.
The segmented images depicted in Figure 4 demonstrate a clear difference between results by threshold value segmentation compared to ZEN Intellesis segmentation. The SEM images are much more accurately segmented using ZEN Intellesis. The aluminum current collector (red) between the two layers can be clearly separated from the rest of the image. However, the images segmented by thresholding reveal that some clusters in the current collector area are misclassified as porosity (green) or particles (yellow). This can be explained by the fact that the current collector in some areas features gray values that fall into the threshold ranges for the particles and porosity phases. Since the gray or color value of a pixel is the only feature taken into account during threshold value-based segmentation, this leads to false segmentation of phases with similar gray values. This false segmentation could be mitigated by applying preprocessing options such as Gaussian smoothing to remove or reduce noise. However, this would reduce image quality and sharpness. Another option would be to fine-tune the threshold ranges. However, in this example increasing the range for the current collector phase to include those misclassified clusters would mean removing even more pixels from the particle phase. This effect is already demonstrated by the chosen values for particles in e.g. the upper left area of the image in Figure 4. By assigning more of the brighter areas to the current collector phase, the particle phase would be underestimated even more. Therefore, a tradeoff must be made.
For the image segmented by ZEN Intellesis, the inclusion of more information regarding the texture and features of the image in addition to the gray or color value can overcome the above problems. Here, each phase is clearly and correctly assigned without any need for additional preprocessing. By creating a widely trained model for segmentation with ZEN Intellesis, even batteries with different particle compositions and thus differing gray values can be evaluated by the same means. For example, SEM images with different gray levels depending on the image acquisition settings and specific sample material can still be segmented and evaluated much faster and more consistently by using a model trained in this way that has learned to “understand” these differences.

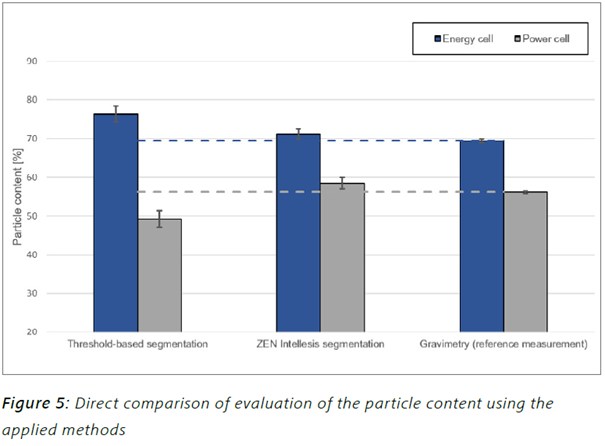
Since in this example the particle phase is of special interest, it is used as a measure to compare the different evaluation methods. Figure 5 shows the determined particle content of the two evaluated cells (energy cell and power cell) using the described methods. The gravimetric value is considered the reference value. As already known from the impression of the segmentation results for the images, evaluation using ZEN Intellesis yields a more comparable result with respect to gravimetric measurement than does threshold-based evaluation. A closer look at the results of threshold-based segmentation reveals that the particle content is higher than the reference for the energy cell, but lower for the power cell. This can be explained by the similarity of gray levels within the images of the energy and power cell leading to over- and underestimation of the particle phase respectively. By considering additional pixel-specific features and not solely the gray value, ZEN Intellesis on the other hand achieves a more robust and precise segmentation, leading to good agreement with the reference value as shown in Figure 5.
Conclusion
From the results of the presented comparison of ZEN Intellesis and threshold-based segmentation against a gravimetric reference measurement, it can be concluded that ZEN Intellesis offers a fast and robust method for segmentation of images. ZEN Intellesis is less prone to over- or underestimation of segmented phases and therefore suited for repeatable and reliable quantitative microstructural analysis.